Interpreting the Oasys Report |
|
Oasys score - discriminant analysis
Cut off for showing an occupational effect: 2.51
OASYS uses the discriminant analysis to score the record between 1 and 4
using a cutoff of 2.5. Scores above this have a 94% specificity for occupational
asthma and a 75% sensitivity when using independent methods of diagnosis. A
sensitivity of 75% means that 75% of those with true occupational asthma have a
positive Oasys score of greater than 2.5. 25% of those with a score less than
2.5 will also have true occupational asthma, so a negative score cannot be used
to exclude occupational asthma
A specificity of 94% means that 94% of those without occupational asthma will
have an Oasys score less than 2.5. There will be 6% of those without
occupational asthma who have a false positive Oasys score.
The scoring system is tolerant of missed or poor readings.
Area Between Curves Score (Clock time or time from waking)
Cut off for showing an occupational effect: 15 l/min/hr
The area between curves score shows the difference between the mean PEFs at work and the mean PEFs away from work (both plotted in 2-hourly sessions and thereby creating 2 curves), by looking at the area between the 2 curves produced. A cut off of 15 L/min/hr has been found to have a sensitivity of 72% and a specificity of 100% (clock time) and 69% and 100% (waking time).
The sensitivity and specificity changes with the amount of data available. When you have 8 readings per day, a record with only 8 work days and 3 rest days has well maintained sensitivity (68%) and specificity (91%). As the number of readings per day fall, so you need more work and rest days to retain sensitivity and specificity.
The scoring system is tolerant of intermittent exposure.
The Timepoint Analysis
Cut off for showing an occupational effect: 1 non-waking point being outside of the 95% CI (denoted with a circle on the area between curves plot).
The timepoint analysis is a statistical analysis that is based on the Chris Stenton paper looking at a statistical analysis of late reactions in challenge testing. It has been shown to have a sensitivity of 71% and specificity of 93%. It is able to pick up smaller changes (so perhaps earlier disease) than the other scoring systems.
Rest-Work Score
Cut off for showing an occupational effect: 16 l/min or 3.3% (if a predicted PEF has been entered)
This score is calculated by taking the mean PEF on rest days (in a day-interpreted record which is a feature of Oasys) and minusing the mean work PEF (in a day interpreted record).
It has been shown to have a sensitivity of 70% for showing a work-related effect.
ABC, Oasys and Timepoint Scores
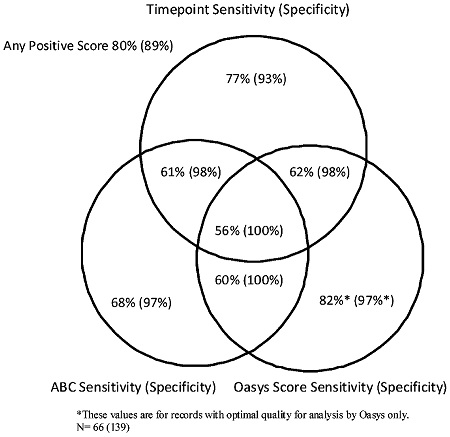
Overall
All the scores are displayed on the Conclusions page of the Report along with their sensitivity / specificity and whether the optimal quality criteria have been met.
The computer generated scores are a useful aid to diagnosing occupational asthma. However human intervention is also required. There are many factors that confound analysis, such as respiratory infections, changing treatment, exercise, domestic allergies, laze and learnging effects, exercise etc etc. The computer is unable to recognise or account for these, so the graphs on the report should be considered alongside the scores.
Comments
How would you interprete these reports:
|
|
Hi there. Which reports are you talking about? Do you mean the ones on the link below?
|
Please sign in or register to add your thoughts.