The 2 Hourly "Time From Waking" Graphs |
|
Click on the "Time From Waking" tab of the Oasys Report to access mean 2 hourly graphs of peak flow by time from waking.
The
graphs shows mean 2 hourly peak flow on the y axis. The x axis shows
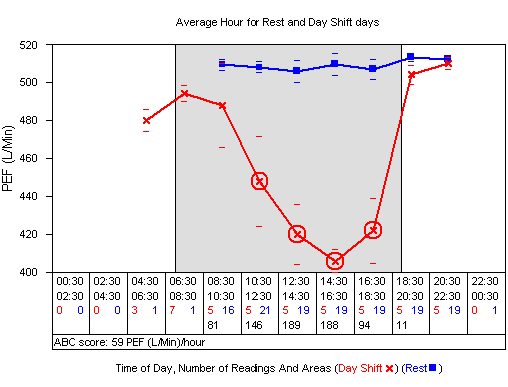
the 2 hourly time range for each point (in hours). These time ranges are calculated as the amount of time that has passed since a patient woke up on a particular day. So if a patient wakes up at 8am and takes a reading at 9.30am this reading will be included in the 00-02 point (it is 1.5 hours after waking). If a patient wakes up at 6 am on a different day and takes a reading at 9.30am again this reading will be included in the 02-04 point (it is 3.5 hours after waking). In the "Time Of Day" graphs both the 9.30am readings would be included in the 08:30-10:30 point. Below the time range is the number of work and rest
readings at each point, the area between the work and rest lines at
each point and below this the ABC score (which is the total of the area
between the work and rest lines divided by the number of hours that the
lines overlap). The ABC score is shown on every graph, but is only
validated for Day Shifts, so is presented as information only. The
Conclusions page of the report shows the validated ABC score. The
blue line with square markers shows the mean rest peak flow for each
two hourly point. The (usually red but sometimes other colours) line
with cross markers shows the mean work peak flow for each 2 hourly
point. The horizontal lines above and below a point show the 95%
standard error of the mean about that point and are drawn in the same
colour as the line and markers.
There can be many graphs shown on
this page of the report and they show slightly different things, so
they are described in more detail below.
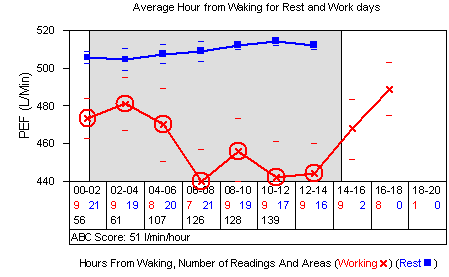
Average Hour from Waking for Rest and Work Days
This
graph shows data for all rest readings and all work readings,
irrespective of shift and specific work exposure. The grey background portion of the graph shows
the mode time of starting work through to the mode time of ending work.
Average Hour from Waking for Rest and Day (or Afternoon) Shift Days
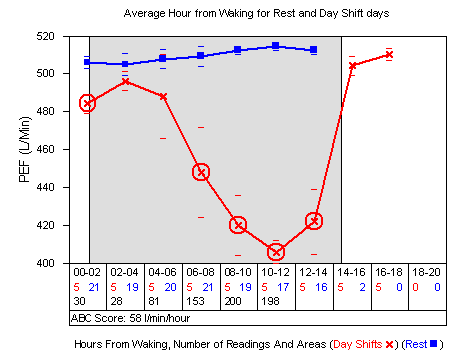
This graph shows data for all rest readings and Day Shift (or Afternoon
Shift) readings only. The two horizontal black lines at the edge of the
grey area indicate the mode times of starting and ending work. Any
darker grey areas (none on this graph) show the earliest and latest
time of starting and ending work. The fact that there are no darker
grey areas tells us that the patient starts and ends work the same amount of time after waking every day during the record (when working a day shift). The night
shift graph later demonstrates a variable end of work time.
Average Hour for Rest and Night Shift Days
This
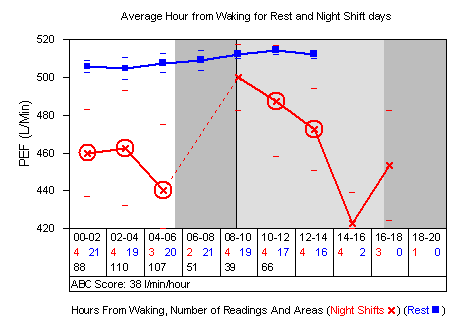
graph shows data for all rest readings and Night Shift readings only.
The shaded areas show the earliest, mode and latest times of starting
and ending work in the same way as the Day and Afternoon shift graphs.
This graph shows that the earliest start work time is 5.5 hours after waking and the mode and latest start work time are 9 hours after waking. The earliest end work time is 17 hours after waking and the mode and the latest end work time are 20 hours after waking.
You might not expect to see many night shift readings shortly after waking, as patients usually wake up a long time before starting work on night shifts. However if a patient works a night shift, sleeps and then wakes up and takes some readings, the
Pseudo Day Interpreter will usually consider these readings to be affected by the preceding night shift and will call them "exposed" readings.
Average Hour for Rest and Work Exposures
If
you have entered multiple work exposures in the record (defined in the
patient demographics and entered from the
data sheet) then Oasys will
draw a graph for each work exposure that has enough data to make it
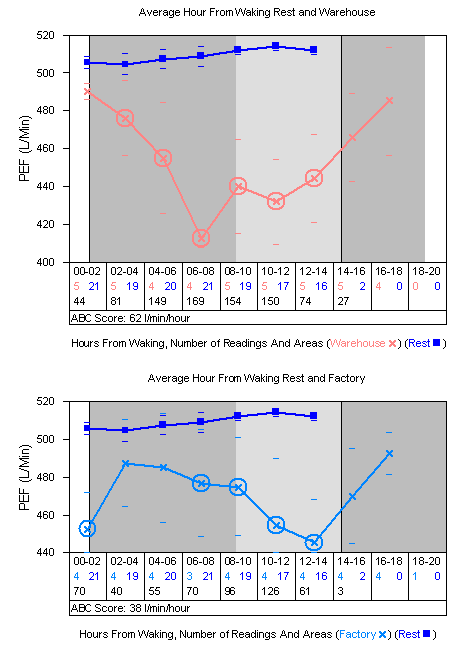
worthwhile. This graph shows data for all rest readings and a
particular work exposure only.
The shaded areas show the earliest, mode and latest times of starting
and ending work in the same way as the Day and Afternoon shift graphs. The first graph below has an earliest and mode time of starting work 1 hour after waking. The latest time of starting work is 9 hours after waking. The mode and earliest time of ending work is 14.5 hours after waking and the latest time of ending work is 19 hours after waking.
Comments
Please sign in or register to add your thoughts.