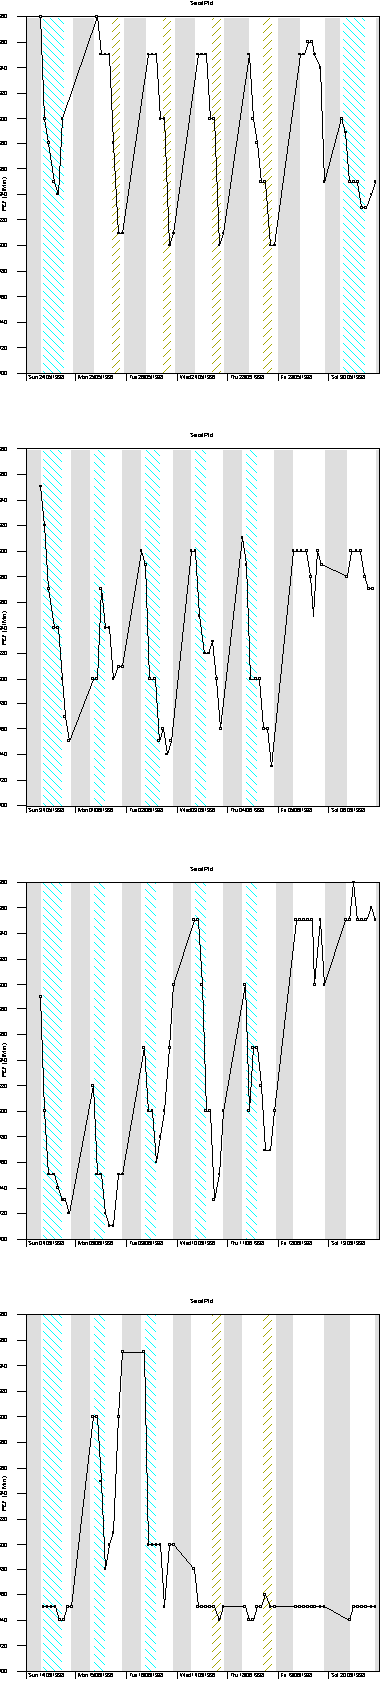
Serial Plot of the Peak Expiratory Flow
The serial plot shows each reading plotted against the time it was taken. The grey shaded areas indicate when the patient was asleep. The patterned shaded areas show when the patient was working (the pattern indicates the type of shift). The light blue diagonal lines are day shifts.
This is a large picture and may take some time to load.
Back to Serial Peak Flows