Analysing the serial plot |
|
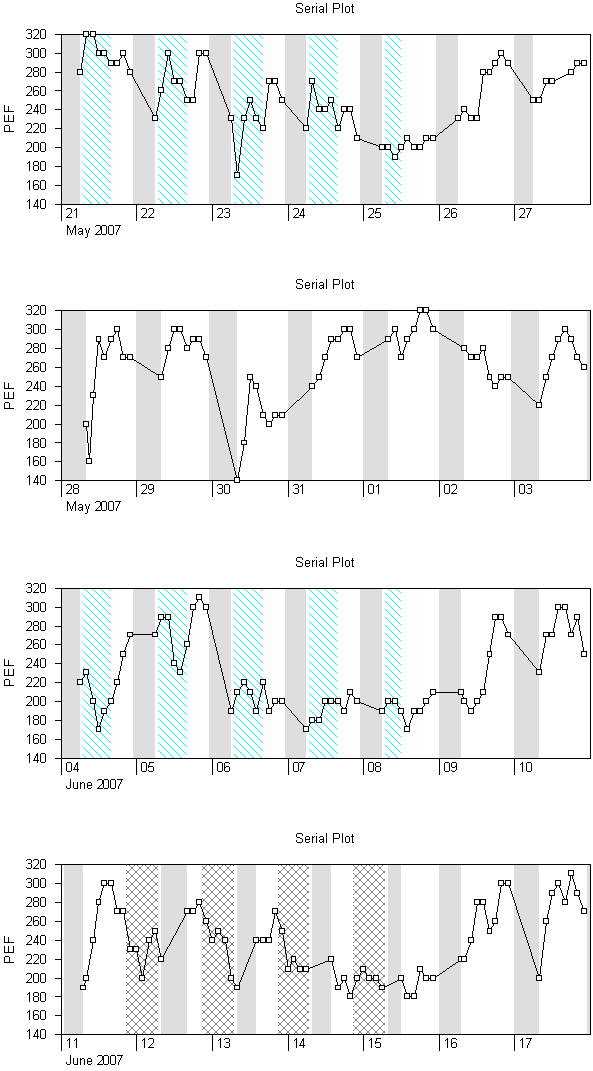
The peak flow can be plotted in the conventional manner with each reading
plotted against the time.
The background is grey when the patient is asleep, white when away from work
and various colours when working to depict each type of shift.

The
relationship with peak flow with work is much less obvious in this tracing. All
of these readings have been utilised in the graphs of daily maximum, mean and
minimum.

Comments
|
The PEFR shows a very wide daily variability of greater than 20% and is suggestive of asthma.
|
Please sign in or register to add your thoughts.